Statistically sound sentiment of significance to regulated LC–MS bioanalysis

In Robert MacNeill’s (Pharmaron; PA, USA) latest column, he is joined by some associates from Quantics Biostatistics (Edinburgh, UK), as they discuss improving bioanalytical testing by using variance components analysis and confidence intervals to better assess matrix effects and enhance assay accuracy and precision beyond current LC–MS guidelines.
 Robert MacNeill received his BSc with Honors in Chemistry from Heriot-Watt University and then his MSc in Analytical Chemistry from the University of Huddersfield, both in the UK. Robert is also a Chartered Chemist and a Fellow of the Royal Society of Chemistry. With decades of experience in all aspects of quantitative bioanalytical LC–MS method development, many of these years heading bioanalytical method development activities in the CRO domain, and a regular author and speaker, Robert is a recognized expert and innovator in the field.
In his current role, Robert is Director of Bioanalysis at Pharmaron in Exton (PA, USA). In addition to directorship duties, he coordinates the bulk of LC–MS method development, also keeps abreast of innovation and technological development in the industry, leading in-house research projects and managing the associated technical writing.
A recent article in this series, ‘A Glitch in the Matrix’, dwelled somewhat on the questions raised by the section of the latest bioanalytical guidance concerned with the assessment of matrix effect. In particular, the differential aspect and how the innate precision measurements are pivotal. This pushes us into an area where, depending on particular background, many a bioanalyst might be a little unsure about the proper mathematical deconstruction.
As a welcome continuation of my foray into this domain of statistical application and evaluation in bioanalysis, I have the honor of being joined by some associates from Quantics Biostatistics (Edinburgh, UK), to author this particular column. At this point, I pass the baton to this talented team!
——————————————————-
As Robert outlined so eloquently in his previous article, the matrix effect is an assay response generated by substances in the sample preparation – the matrix – other than the analyte of interest. This can be caused by a range of co-eluting compounds, as well as ion enhancement/suppression from biological matrices such as blood, serum or urine. It is important to quantify and minimize the matrix effect in an assay, a process which usually takes place at the method development stage and is confirmed in the validation.
To do this, the current published guidances suggest testing three replicates each of a high- and low-concentration quality control sample prepared using matrix from at least six different lots. The assay is deemed to have a suitably insignificant matrix effect if it passes the following metrics:
- Accuracy: The measured concentration should be within ±15% from the nominal concentration for each lot evaluated.
- Precision: The percentage coefficient of variation (%CV) of the measurements should not exceed 15% for each lot evaluated.
As Robert has previously outlined, the testing outlined in the guidances could be viewed as unnecessarily laborious, with 36 samples required to be tested when strictly following the recommendations. We wanted to outline some statistical improvements which could be made to access efficiencies while maintaining the highest quality of testing to protect end users.
- The measurement of CV does not provide the full picture
Quantics has written in the past about some of the flaws of using %CV as a suitability criterion for precision in other contexts [1]. In this case, however, we want to highlight a fundamental issue with how the variability caused by the matrix effect is treated under the current guidances.
Under the method outlined in the guidances, through a faint cloud of ambiguity in the interpretation, we only measure the intra-lot variability – that associated with repeated measurements of the same lot. That is all well and good, but it is not the only source of variability. Also important is the inter-lot variability – the variability associated with measurements made using different lots of matrix. This is currently not accounted for in the guidances and can be a large source of variability.
This process that may be the answer is known as a Variance Components Analysis (VCA), and therein it is important to examine both the inter- and intra-lot variability to give a comprehensive account of the nature of the matrix effect in a particular assay. For example, it is useful to be able to determine that no one particular lot exhibits an unusually large matrix effect.
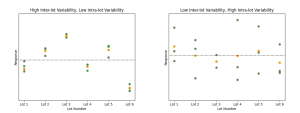
Left: Simulated data showing high inter-lot variability and low intra-lot variability. Right: Simulated data showing low inter-lot variability and high intra-lot variability. In both plots, green points represent responses measured from each lot. Orange points represent the mean of the responses for each lot. The black dashed line shows the mean of the mean responses. We see in the left-hand panel that the response groups are tightly packed, but the orange points fall further from the dashed line. By contrast, the orange points fall closer to the dashed line on the right, but the response groups themselves have a greater spread.
- Point estimates give a poor representation of the matrix effect – use confidence intervals instead!
The criteria outlined in the guidances are based on point estimates of the accuracy and precision. While this is definitely a simple solution, it is far from the best approach from a statistical point of view.
Whenever we make a measurement, we are trying to access the “true” value of some parameter of interest. We can be almost certain that our result will be different from this “true” value when we look at a point estimate alone, due to measurement error and natural variability. This means that we actually know very little about the “true” value and how close our point estimate is to it.
The solution is a confidence interval (CI) [2]. A CI gives us a range in which the “true” value of our parameter might plausibly fall based on the variability of the measured data. While we still do not know exactly what this “true” value is, we have more information about where it may lie than when using the point estimate alone. A common analogy is fishing in a muddy pond: you are far more likely to catch a fish using a net than with a spear gun.
A more statistically sound way to set a criterion on the accuracy of the measurement, therefore, would be to state that a CI calculated on the measured value must fall entirely within pre-set equivalence limits set based on the nominal concentration of the sample. This is known as an equivalence test, and is fast becoming more widely used in place of tests on point estimates [3].
A comprehensive bioanalytical testing process is vital for providing high quality products and protecting end users. As such, it is essential that robust statistical methods are used to ensure no flawed products slip through the cracks. Simultaneously, strategic use of these statistical techniques can lead to efficiencies which benefit manufacturers, saving valuable time and resources while maintaining product quality.
——————————————————-
Thank you to Quantics Biostatistics! A more thorough viewing of the separate sources of variability via VCA, and then the increasingly prominent utility of CIs feeding into equivalence tests. More fastidious, perhaps, but are these part of the right mindset to aspire to? Intuitively, one would have to agree, and a collective step into a slightly deeper statistical understanding should not be feared! More details of variance components analysis and equivalence testing can easily follow…
Interested in reading more of Robert MacNeill’s columns? You can find his collection here.
Disclaimer: the opinions expressed are solely that of the authors and do not express the views or opinions of their employers, Bioanalysis Zone or Taylor & Francis Group.
Our expert opinion collection provides you with in-depth articles written by authors from across the field of bioanalysis. Our expert opinions are perfect for those wanting a comprehensive, written review of a topic or looking for perspective pieces from our regular contributors.
See an article that catches your eye? Read any of our articles below for free.